Over the years, India has experienced severe income/wealth inequality. The finding on inequality remained consistent regardless of the approach used to measure it. In other words, wealth/income disparity has shrunk slightly. Different sources, however, provide a different picture of the country. According to the State of Inequality in India Report, 2022, extreme poverty in India has decreased by 12.3 percentage points between 2011 and 2019 and remains low. However, the report observes that rich 0.1% has been found to account for 5 to 7 percent of the national income in the country. In 2019-20, the top 1% earns almost thrice as much as the bottom 10%. It finds that the share of the top 1% in the total income is 6.82% whereas the top 10% earns 32.52% of total income. While the bottom 50% only held approximately 22% of total income. As per the Periodic Labour Force Survey (PLFS) 2019-20, a monthly salary of a minimum of Rs 25,000 (Rs 300,000 yearly) is amongst the top 10% of the total wages earned. This is an alarming finding presented by the report. It demonstrates that with a 3-lac annual income, one may be among the top 10% wage earner.
NFHS-V (National Family Health Survey), 2019-21 report finds that 54% rural population (bottom 40% of the total population) belonged to the two bottom quintiles (poorest and poor) groups while in the urban area only 10.4% of the population is poor. Additionally, 74% of the urban population in India belonged to the top two wealth quintiles (richest and rich). It shows that there is a skewed higher poor population in rural India.
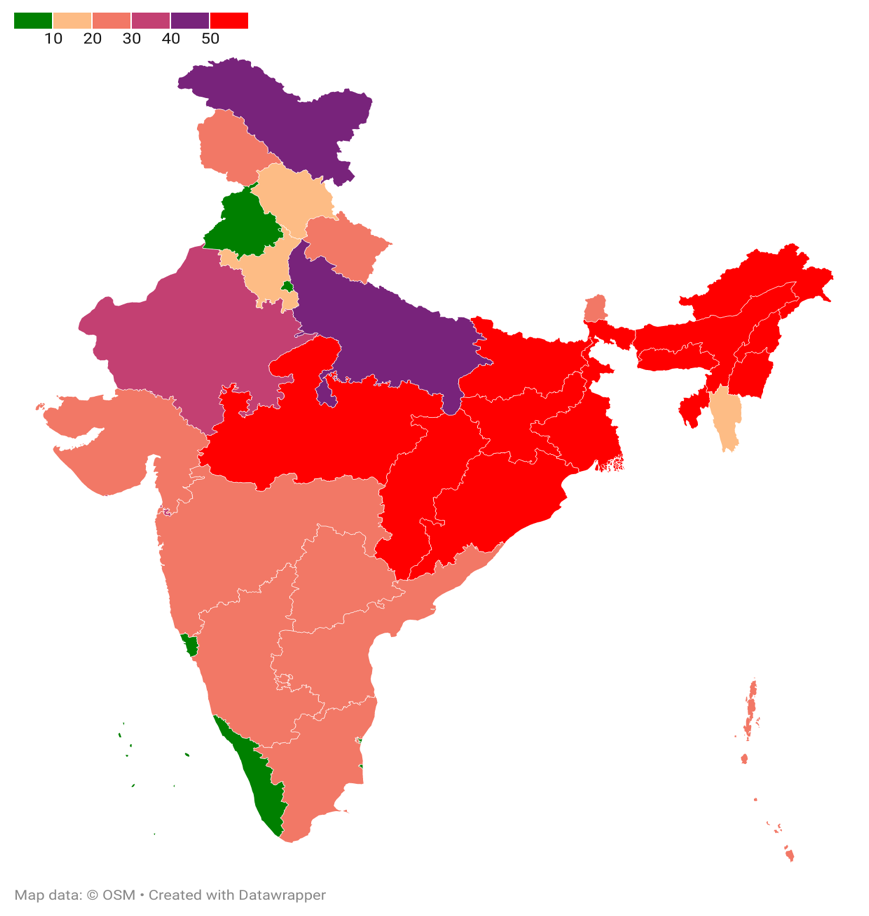
It also highlights high regional inequality among the states in the country. Northern and northeastern states fair worse when it comes to their population percentage in the bottom two wealth quintiles. Twelve states and union territories have more than half of their population in the bottom two wealth quintiles. Assam, Bihar, and Jharkhand are the top three states with the highest population in the bottom two wealth quintiles. Delhi, Goa, and Kerala are three states (in that order) that have the lowest population in the same category. According to the report, the country has a pronounced north-south divide, with southern states performing better than northern ones while dealing with income inequality. In contrast, southern states have a lower proportion of the poor who fall into the bottom two quintiles of income.
Figure 1: Population Percentage of Poor and Poorest (bottom 40% population) in Different States in India
Another study, World Inequality Database (WID) Report, 2021 puts India in the category of ‘extreme inequalities’ countries. The report states that ‘the average national income of the Indian adult population is INR 204,200. While the bottom 50% earns INR 53,610, the top 10% earns more than 20 times more INR 1,166,520. While the top 10% and top 1% hold respectively 57% and 22% of total national income, the bottom 50% share has gone down to 13%. India stands out as a poor and very unequal country, with an affluent elite’. This inequality widens when we compare the wealth possession of the top 10% and the bottom 50% population. Reports find that the top 10% population in India owns 65% and the bottom 10% is just 6% of the nation’s household wealth. i.e., to say that wealth inequality in India between two top 10% and bottom 50% is more than income inequality.
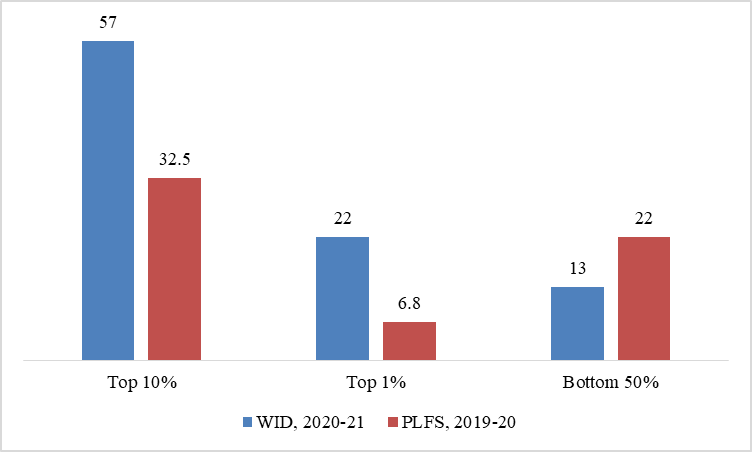
For a micro-level study, the World Inequality Report, 2021 must be compared to the just-released State of Inequality in India Report, 2022. Both analyses find significant income disparities between the bottom 50% and top 10% of the population. WID, however, places a higher value on the inequality between these groups than PLFS. According to WID and PLFS, the top 10%’s income is different from the bottom 50%’s by 24.5 percentage points. i.e., the top 1 or 10 percent of the population, on average, have higher incomes than what the PLFS reports, according to WID.
Figure 2: Comparing Income Inequality with WID, 2020-21 and PLFS, 2019-20 in India
It is challenging to directly compare the NFHS-V dataset to the WID and PLFS datasets since it does not include information on income disparity between the poorest 50% of the population and the top 1% or 10% of the population and only provides information on wealth quintiles. According to the study, the wealthiest households are concentrated in urban areas that solely estimate the population proportion in each quintile.
Reasons for High Inequality:
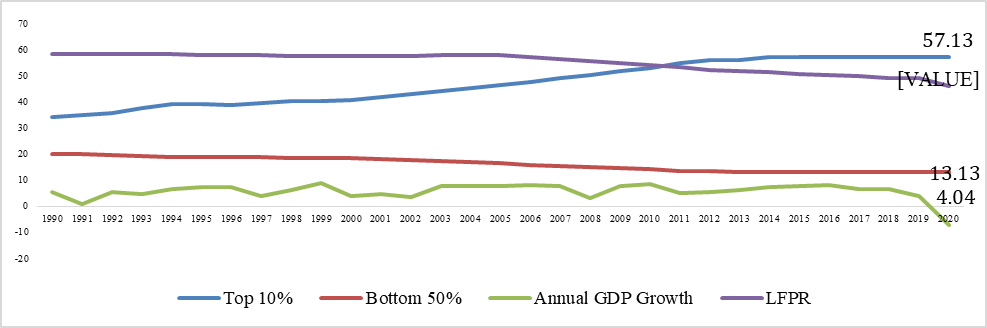
There can be several reasons for rising income inequality in India. Inequality of both income and wealth is exacerbated by one of the lowest female participations in the world which is just above 18% in 2021. According to the World Bank, 2021 overall labour force participation rate for India is as low as 46.3 which is lower than that of Pakistan (50.2%). Figure 3 shows that total labour force participation has been on the decline since 2010 and it was lowest in 2020 in the decade which contributed to keeping a large number of Indians under poverty.
India has had strong economic growth throughout the years, but this prosperity has not led to a reduction in poverty in the nation. The figures below demonstrate how ineffectual the trickle-down theory has been. The graph demonstrates that since 1990, there has been an increase in income disparity between the bottom 50% of the population and the top 10%. It is clear that the services and industrial sectors were unable to produce jobs, despite the strong economic development.
Figure 3: Income distribution between top 10 and bottom 50% of the population, Annual GDP Growth and Labour Force Participation Rate (15+ Age) in Post-liberalization India
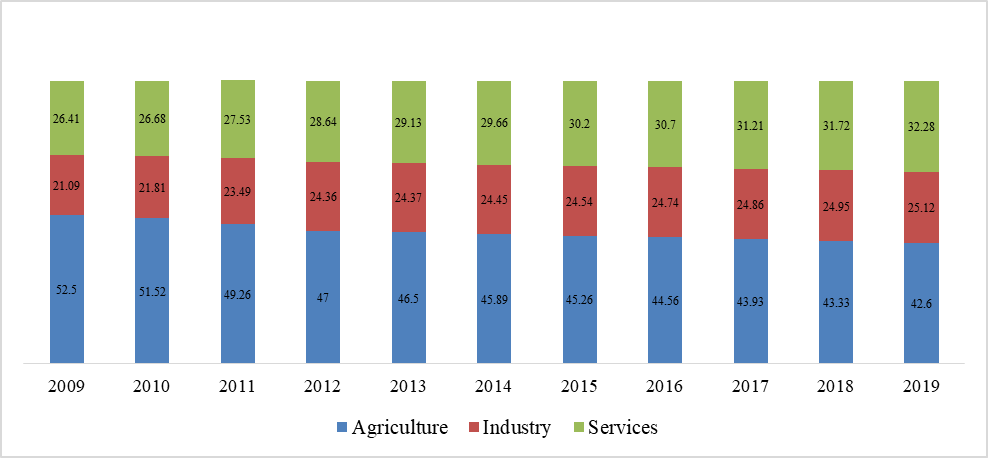
Second, the Inability of the industry and services sector to generate sufficient jobs for people migrating from agriculture is another reason for high unemployment and higher unequal population belonging to the bottom 50% population in India. In this period, there is a 10 percent decline in the workforce in the agriculture sector and subsequently 4 percent and 6 percent increase in industry and services sector respectively. As Figure 4 shows that from 2012-2019, there is not even a 1 percentage point increase in the workforce employed in the industry sector. i.e., it is a stagnant sector now which includes iron and steel, textiles, automobiles, IT, etc. are not sufficiently producing the jobs.
Figure 4: Percentage of the Workforce
Third, social service spending in India has grown over time, going from 6.2 percent in 2014–15 to 26.6 percent in 2021–22. (As per Budget Estimates). Health spending has steadily increased from 4.5 percent to 6.6 percent, whereas social service spending in education has somewhat decreased (from 10.8 percent to 9.7 percent). Even Nevertheless, hefty out-of-pocket medical expenses are pushing individuals into poverty. A family’s ability to afford schooling can also push them below the poverty threshold. Even more concerning is the fact that education’s percentage of overall spending has decreased over the past ten years, falling to 10.4 in 2020–21.
Fourth, as per the State of Inequality in India Report, 2021, 20.71% were casual workers, 33.50% were regular workers, and 45.78% were self-employed workers. The report claims that the labour force participation rate for the year 2019-20 is 50.2% (FLFP was 30%, and MLFP was 76.8%). The rural LFPR in 2019-20 was 50.7% and urban was 49.3%. With a high percentage of casual workers and low LFPR it is expected that there would be a higher poverty percentage in India as NFHS-V, 2019-21 corroborates. According to it, 45% of households in the country have BPL cards (Below Poverty Line) which is a maker to recognize the poor. However, access to BPL cards cannot be a robust marker to measure poverty as according to NFHS-IV, 2015-16,38.6 % of households had BPL cards which are lower than the latest findings (45%). This does not align with the declining poverty in India and ideally, the percentage of households having BPL cards should go down over the years.
With low LFPR (50.8 in 2019-20) and a high unemployment rate (4.8% in 2019-20) curbing inequality is going to be a daunting task for the Government of India. More so when 71 percent of the population in scheduled tribe and 49 percent of the population in scheduled caste belong to the two bottom-most lowest wealth quintiles (NFHS-V, 2019-20). Thus, it can be contended that there is a higher percentage of marginalized communities which overwhelmingly belong to the bottom wealth quintile in the country and this, in turn, contributes to the overall higher poverty percentage. The Indian government and several other states need to do more in terms of generating employment opportunities and higher spending on social services such as health, and education while trying to combat inequality.
[Photo by Jorge Royan, via Wikimedia Commons]
*Dr. Prashant Kumar Choudhary is an Assistant Professor at the Department of Public Policy, Manipal Academy of Higher Education (MAHE), Bangalore, India.